A primer to Amplification Breakpoint Ranking and Assembly (ABRA) Analysis
Cancer Discovery. 2011 1:35-43 [PubMed]
The addiction of cancer cells to causal gene fusions often results in amplification, in vivo, which can be exploited to reveal unidentified recurrent gene rearrangements. Based on this observation, we developed an integrative genomic-based approach called Amplification Breakpoint Ranking and Assembly (ABRA), to explore driving gene fusions in epithelial tumors with heavily rearranged genomes.
The Principle of ABRA analysis
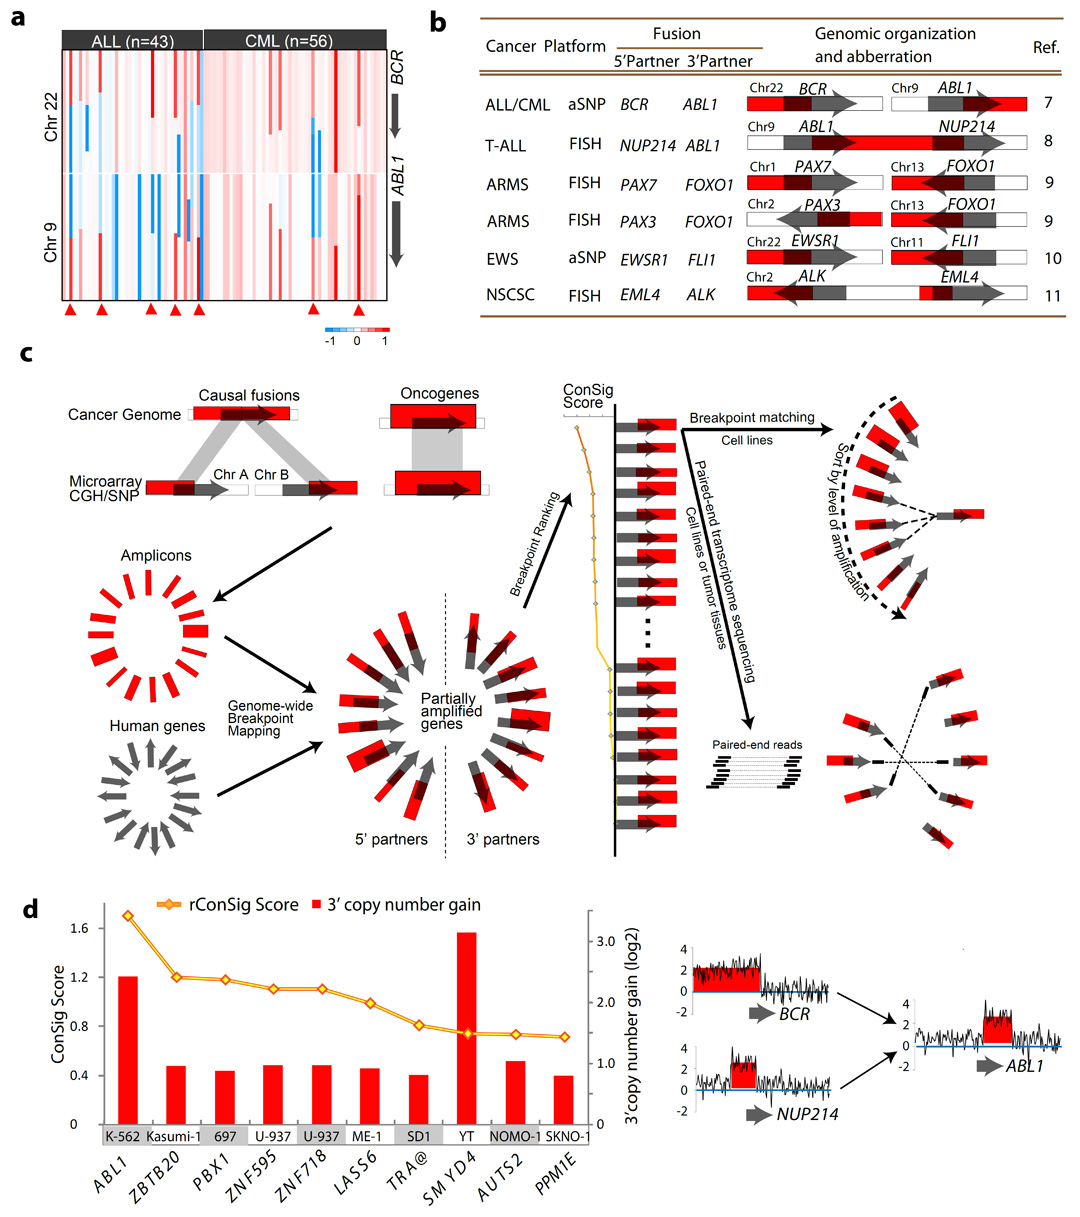
To understand the characteristic features of driving gene fusions in cancer, we previously carried out a large-scale integrative analysis of cancer genomic datasets matched with gene rearrangement data (1). As part of this analysis, we observed that in many instances, a small subset of tumors or cancer cell lines harboring an oncogenic gene fusion displays characteristic amplification at the site of genomic rearrangement (2-6) (Figure 1a-b). Such amplifications usually affect a portion of the fusion gene, and are generally considered secondary genetic lesions associated with disease progression, drug resistance, and poor prognosis (2, 4-8). In contrast, high level copy number changes that result in the marked over-expression of oncogenes usually encompass the target genes at the center of overlapping amplifications across a panel of tumor samples. Thus, a “partially” amplified cancer gene may suggest that this gene participates in a genomic fusion event important in cancer progression. This is the result of several independent genetic accidents including the formation of the gene fusion and subsequent amplification, suggesting possible selective pressure in cancer cells for this aberration.
Toward this end, we developed an integrative genomic approach called amplification breakpoint ranking and assembly (ABRA) to discover causal gene fusions from cancer genomic datasets. Based on the fusion breakpoint principle previously described (1), amplifications associated with gene fusions usually involve the 5’ region of 5’ partners, and 3’ region of 3’ partners. Further, the amplification levels of 5’ and 3’ fusion genes will be identical due to their co-amplification as a single fusion gene. This observation provided the rationale to assemble putative gene fusions from amplification breakpoints by matching the amplification levels of candidate 5’ and 3’ partners. We therefore developed ABRA analysis, which leverages the in vivo amplification and breakpoint analysis in cancer cells to assemble novel gene fusions and predict their tumorigenicity. Concept signature analysis was developed in our previous study (17) and provides a Consig score, which is applied to rank biologically relevant candidates based on prior knowledge and has been incorporated into ABRA analysis.
Methodology
In order to nominate partially amplified
gene fusions systematically from genomic data, we employed ABRA across a
compendium of data from cancer cell lines, as breakpoint analyses are
more reliable in uniform cellular populations as opposed to tumors which
are made up of multiple cell types many of which are not malignant. The
workflow is described in Figure 1c.
First, copy number data from the array CGH or
array SNP datasets were segmented by the circular binary segmentation
(CBS) algorithm (9). The level of amplification was determined by
comparing the relative copy number data of the amplifications with the
neighboring segments, and the breakpoints having equal to or more than 2
copies number gain were selected (≥0.75). Amplifications spanning more
than 500kb are included in the analysis. The genomic position of each
amplification breakpoint was mapped with the genomic regions of all
human genes. The genomic region of each human gene was designated as the
starting of the transcript variant most approaching the 5’ of the gene,
and the end of the variant most approaching the 3’ of the gene. The
partially amplified genes were classified into candidate 5’ and 3’
partners based on the association of amplification breakpoints with gene
placements. 5’ amplified genes are considered as 5’ partners, 3’
amplified genes as 3’ partners.
Second, we sought to identify the partially amplified “cancer genes” as driver fusion gene candidates. This can be easily achieved by mapping 3’ amplified genes to known cancer genes defined by cancer gene census, which however, may overlook the less characterized ones. To evaluate the relevance of partially amplified genes underlying cancer, we adopted the “concept signature technology” (ConSig) developed in our previous study (11), which can preferentially identify biologically meaningful genes based on their association with the “molecular concepts” frequently found in known cancer genes. This score is especially discriminative for 3’ fusion genes (11). We therefore rated the 3’ amplified genes with acceptable breakpoints (see below criteria, Figure 2a), by their radial concept signature scores (in brief ConSig Score). The top scored 3’ amplified cancer genes were considered as driver fusion gene candidates.
Third, the level of amplification for the selected 3’ amplified gene was matched with 5’ amplified genes from the same cell line to nominate putative 5’ partners. The actual location and the quality of the breakpoint will be manually curated with the un-segmented relative quantification of DNA copy number data.
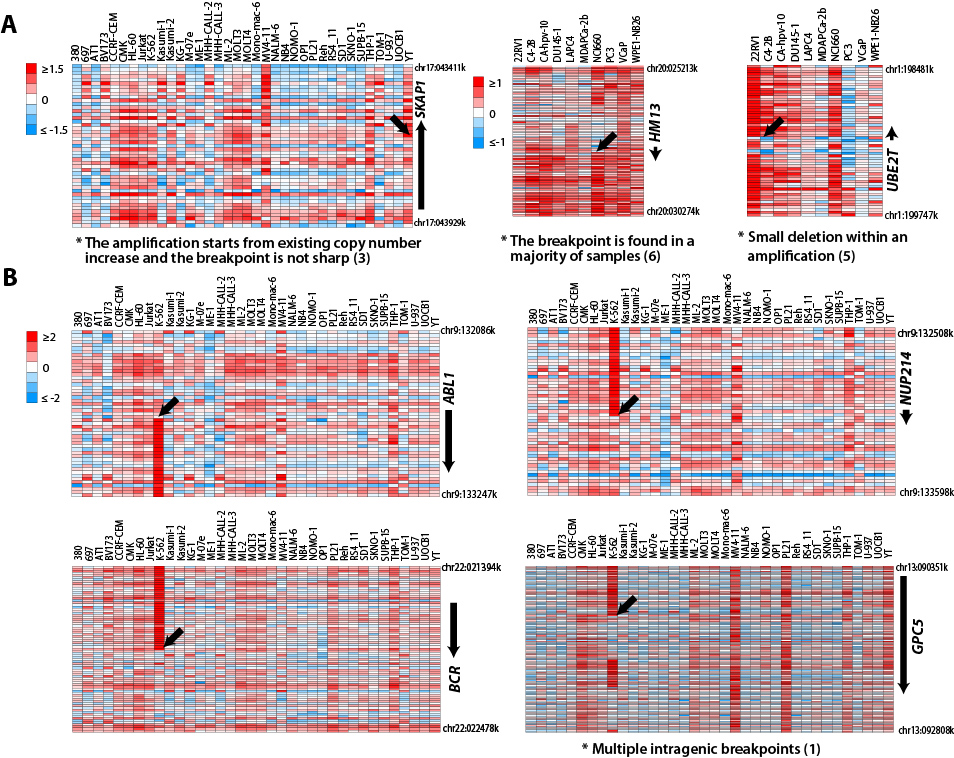
The situations when the amplification
breakpoint is not acceptable (Figure 2):
(1) Multiple intragenic breakpoints;
(2) The candidate is not the gene closest to
the amplification breakpoint;
(3) The amplification starts from existing
copy number increase and the breakpoint is not sharp;
(4) The breakpoint locates at the centromere
or the end of the chromosome;
(5) The breakpoint is the result of a small
deletion within an amplification;
(6) The breakpoint is found in a majority of
samples.
A major concern for the breakpoint analysis was that the segmentation process could have slightly different estimation of the breakpoints from the actual location. This is especially critical for breakpoint assembling. To overcome this problem, the DNA breakpoints within 10 kb up and 1kb downstream region of a gene will be assigned to this gene during breakpoint ranking; and 20kb up- and downstream during breakpoint assembling. In practice, this window can be adjusted to improve the performance of ABRA analysis.
As a proof of concept, we tested the ABRA approach using a published single nucleotide polymorphism microarray (aSNP) dataset (2) generated from 36 leukemia cell lines including the K-562 chronic myeloid leukemia cell line known to harbor the amplified BCR-ABL1 fusion (12). We inferred the relative DNA copy number data and identified all 5’ and 3’ amplified genes from the 36 cell lines (≥2 copies). In this dataset, ABL1 was the top ranking gene with a 3’ copy number increase (Figure 1d, left panel). The amplification levels of all 5’ amplified genes in K-562 cells were then matched with ABL1 to nominate potential 5’ partners. In total, six 5’ amplified genes were found in K-562 and five matched the level of ABL1 3’ amplification. After curation of the amplification breakpoints, BCR and NUP214 were nominated as ABL1 fusion partner candidates (Figure 1d, right panel, see Figure 2 for the criteria of candidate selection).
In this study, we applied in silico amplification breakpoint assembly to nominate the fusion partners. In general, we recommend applying this approach to cancer cell lines that have uniform cell populations, thus the copy number estimation will be more reliable. And repeated hybridization using the highest resolution microarray CGH or SNP platforms are usually needed to pinpoint the intragenic amplification breakpoints. Alternatively, the amplification breakpoints can be assembled by analyzing the samples harboring the partially amplified fusion genes with paired-end transcriptome sequencing. This strategy is particularly useful to nominate fusion partners in tissue samples. Further, the link of ABRA with next generation sequencing will comprise a highly cost-effective approach to nominate causal genetic aberrations from this data. By leveraging the public or private cancer genomic datasets, we can nominate candidate amplified fusion genes, and then focus the sequencing effort to a small number samples harboring these candidates. This approach will be particularly valuable considering the exponential accumulation of public genomic datasets from large cancer genome projects, such as The Cancer Genome Atlas (TCGA), the Tumor Sequencing Project (TSP), the Cancer Genome Project (CGP), and individual deposits by laboratories world-wide.
References
Wang XS, Prensner JR, Chen G, et al. An integrative approach to reveal driver gene fusions from paired-end sequencing data in cancer. Nat Biotechnol 2009; 27:1005-11.
Mullighan CG, Miller CB, Radtke I, et al. BCR-ABL1 lymphoblastic leukaemia is characterized by the deletion of Ikaros. Nature 2008; 453:110-4.
Graux C, Cools J, Melotte C, et al. Fusion of NUP214 to ABL1 on amplified episomes in T-cell acute lymphoblastic leukemia. Nat Genet 2004; 36:1084-9.
Barr FG, Nauta LE, Davis RJ, Schafer BW, Nycum LM, Biegel JA. In vivo amplification of the PAX3-FKHR and PAX7-FKHR fusion genes in alveolar rhabdomyosarcoma. Hum Mol Genet 1996; 5:15-21.
Ferreira BI, Alonso J, Carrillo J, et al. Array CGH and gene-expression profiling reveals distinct genomic instability patterns associated with DNA repair and cell-cycle checkpoint pathways in Ewing's sarcoma. Oncogene 2008; 27:2084-90.
Koivunen JP, Mermel C, Zejnullahu K, et al. EML4-ALK fusion gene and efficacy of an ALK kinase inhibitor in lung cancer. Clin Cancer Res 2008; 14:4275-83.
Stergianou K, Fox C, Russell NH. Fusion of NUP214 to ABL1 on amplified episomes in T-ALL--implications for treatment. Leukemia 2005; 19:1680-1.
Attard G, Clark J, Ambroisine L, et al. Duplication of the fusion of TMPRSS2 to ERG sequences identifies fatal human prostate cancer. Oncogene 2008; 27:253-63.
Olshen AB, Venkatraman ES, Lucito R, Wigler M. Circular binary segmentation for the analysis of array-based DNA copy number data. Biostatistics 2004; 5:557-72.
Futreal PA, Coin L, Marshall M, et al. A census of human cancer genes. Nat Rev Cancer 2004; 4:177-83.
Wang X-S, Cao Q, Prensner JR, et al. Integrative Analyses Reveal the Functional and Genetic Associations of Gene Fusions in Cancer. submitted; 2009.
Wu SQ, Voelkerding KV, Sabatini L, Chen XR, Huang J, Meisner LF. Extensive amplification of bcr/abl fusion genes clustered on three marker chromosomes in human leukemic cell line K-562. Leukemia 1995; 9:858-62.