Supplementary data for Xu QW, Zhao W, Wang Y, Sartor MA, Han DM, Deng JX, Ponnala R, Yang JY, Zhang QY, Liao GQ, Qu YM, Li L, Liu FF, Zhao HM, Lan F, Yin YH, Chen WF, Zhang Y, Wang XS, An integrated genome-wide approach to discover tumor specific antigens as potential immunological and clinical targets in cancer. Cancer Research. 2012 doi: 10.1158/0008-5472.CAN-12-1656. [Abstract]
| Putative
tumor specific antigens in multiple tumor entities can be downloaded
from
here.
Putative overexpressed antigens in multiple tumor entities can be downloaded from here. |
The principle of HEPA analysis
Tumor
specific antigen genes are pivotal targets in the management of
human cancers. By analysis of gene expression profiles for eight
well-established tumor specific antigen genes widely accepted as
clinical targets,we
observed that these proto-type tumor-specific antigen genes
usually exhibit distinctive heterogeneous expression profiles (Figure
1).
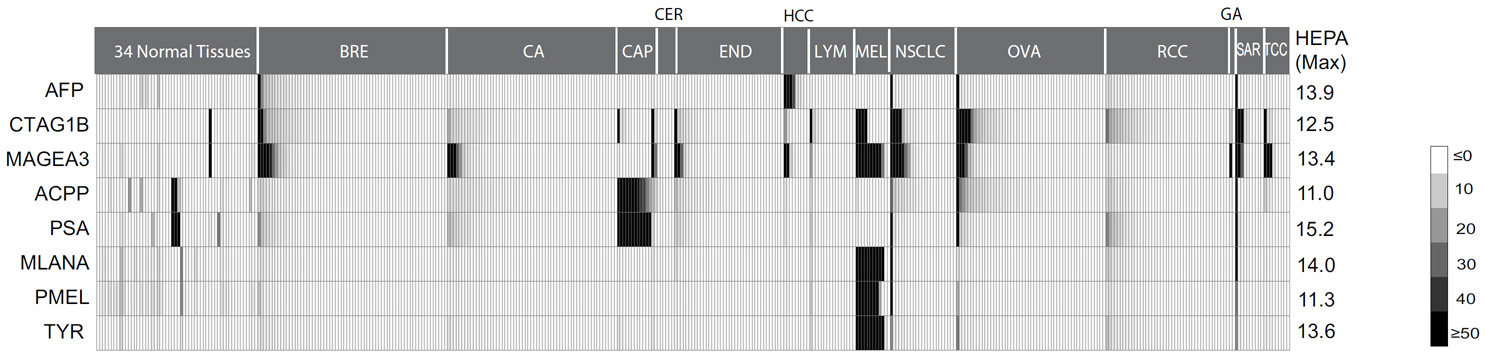 Figure 1. The heterogenous gene expression profiles of 8 prototype tumor specific antigens widely adopted as clinical targets. Gene expression profiles are analyzed using publicly available Affymetrix U133 plus 2.0 microarray datasets for 34 normal tissues from human body index dataset and 28 cancer types (see Data Source). The expression values are median-centered and scaled to a median absolute deviation of 1, and then depicted by grey color scales. Each of the antigens shows a typical heterogeneous expression pattern. |
This observation lays the foundation to discover tumor
specific genes as immunological and clinical targets by gene
expression profile analysis. Toward this end, we developed a novel
analysis called the Heterogeneous Expression Profile Analysis (HEPA),
incorporating the key expression features of clinically adopted TSA
genes (Figure 2).
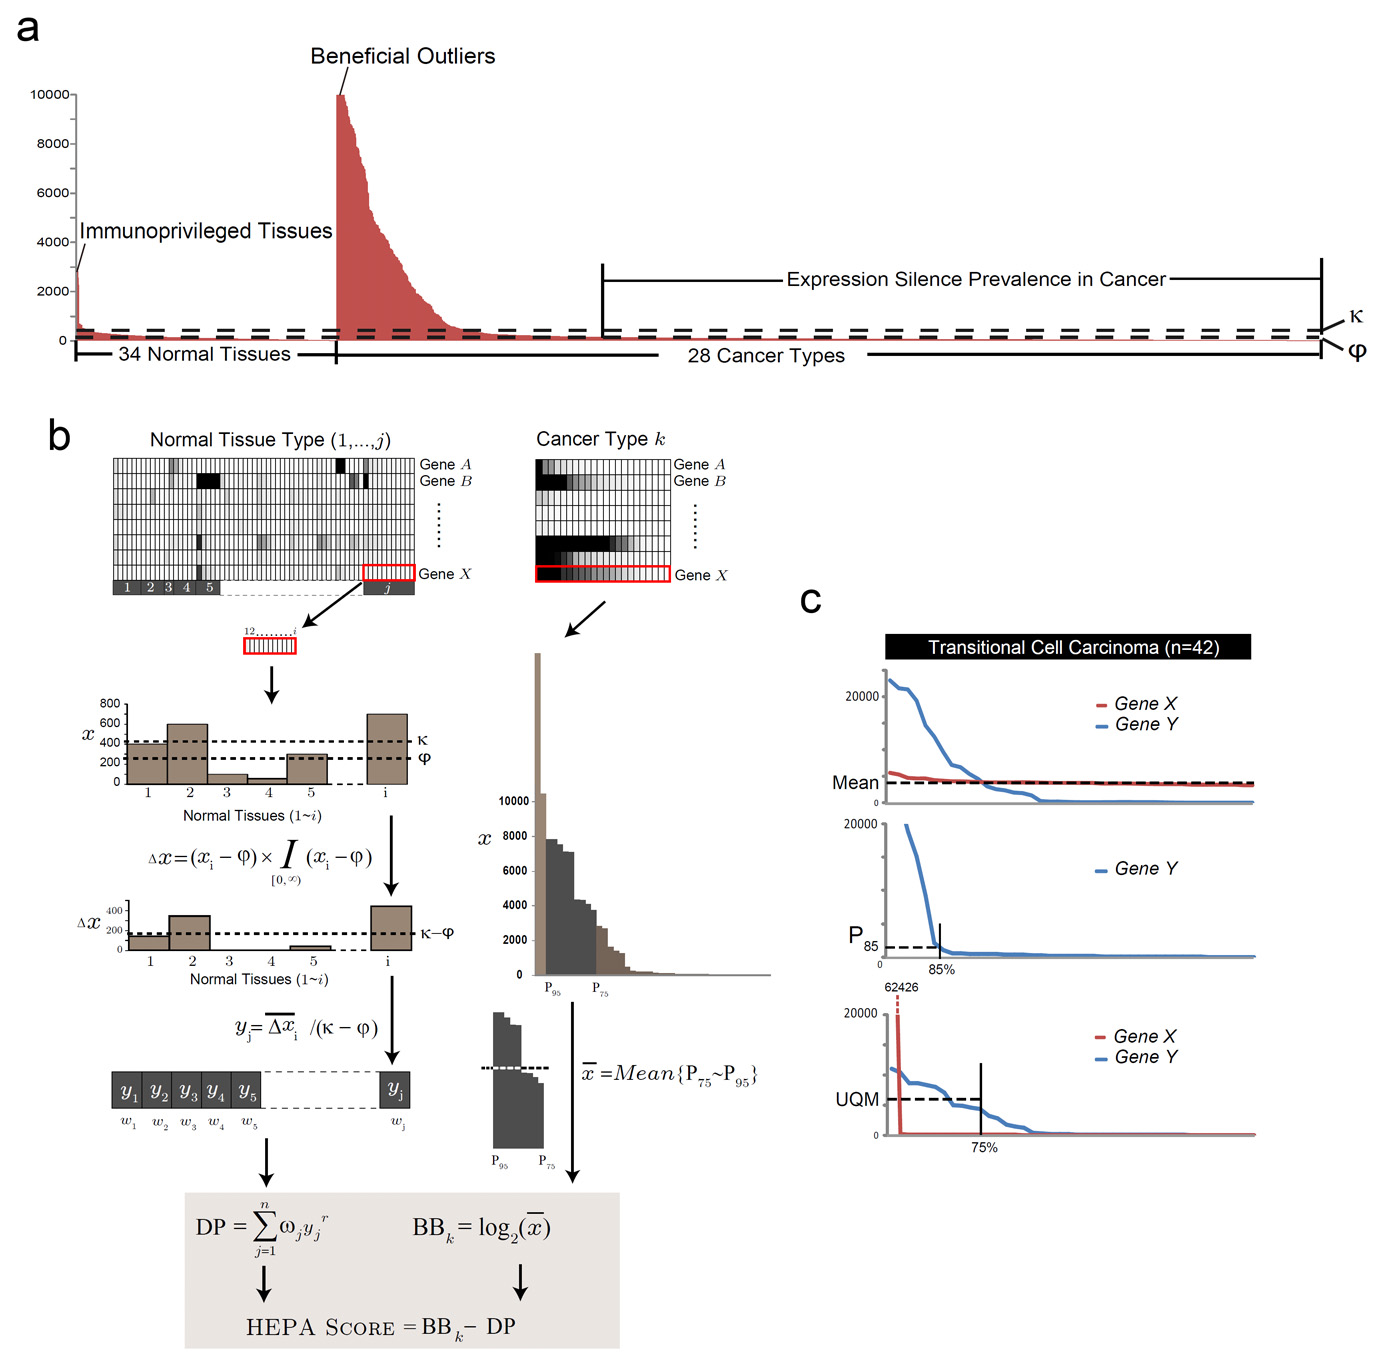 Figure 2. The principle and algorithm of HEPA analysis. A. The heterogeneous expression profile of MAGEA3, a canonical cancer-testis antigen gene, across a compendium of gene expression datasets from multiple tumor entities and a spectrum of normal tissues. Individual samples from normal or malignant tissues are sorted in descending order based on gene expression signals to reveal the marked over-expression of MAGEA3 in a small subset of tumor or normal samples (outliers). B. The algorithms of HEPA analysis. Microarray gene expression data from j normal somatic tissue types and cancer type k are shown in the heat-map. Data were processed as described in Methods, resulting in a final HEPA score which accentuates heterogeneously expressed genes in cancers. C. The rationale of using the adjusted upper quartile mean (Mean |
The Source Data for Heterogeneous Expression Profile Analysis
| GEO ID | Primary site | Tissues types (n) | Samples (n) |
| GSE7307 | Normal tissues from multiple sites | 34 | 291 |
| GSE2109 | Cancer tissues from multiple tumor entities | 28 | 1800 |
| GSE6764 | Tumor tissues from hepatocellular carcinoma | 1 | 35 |
| GSE6338 | Tumor tissues from lymphoma | 1 | 40 |
| GSE7127 | Cell lines from melanoma | 1 | 63 |
Note: for most cancer types, GSE7307 and GSE2109 are sufficient for analysis. The other three datasets can be excluded from the analysis unless liver cancer, lymphoma or melanoma are concerned.
Gene expression values were extracted with the MAS5 algorithm and were scaled to a reference sample, using a house-keeping gene probe set provided by Affymetrix. These normalized expression signals are directly applied to HEPA analysis, which represent “absolute expression level” as apposed to “relative expression level” in mean- or median-centered data.
Algorithms for Heterogeneous Expression Profile Analysis
A. Parameters of HEPA analysis
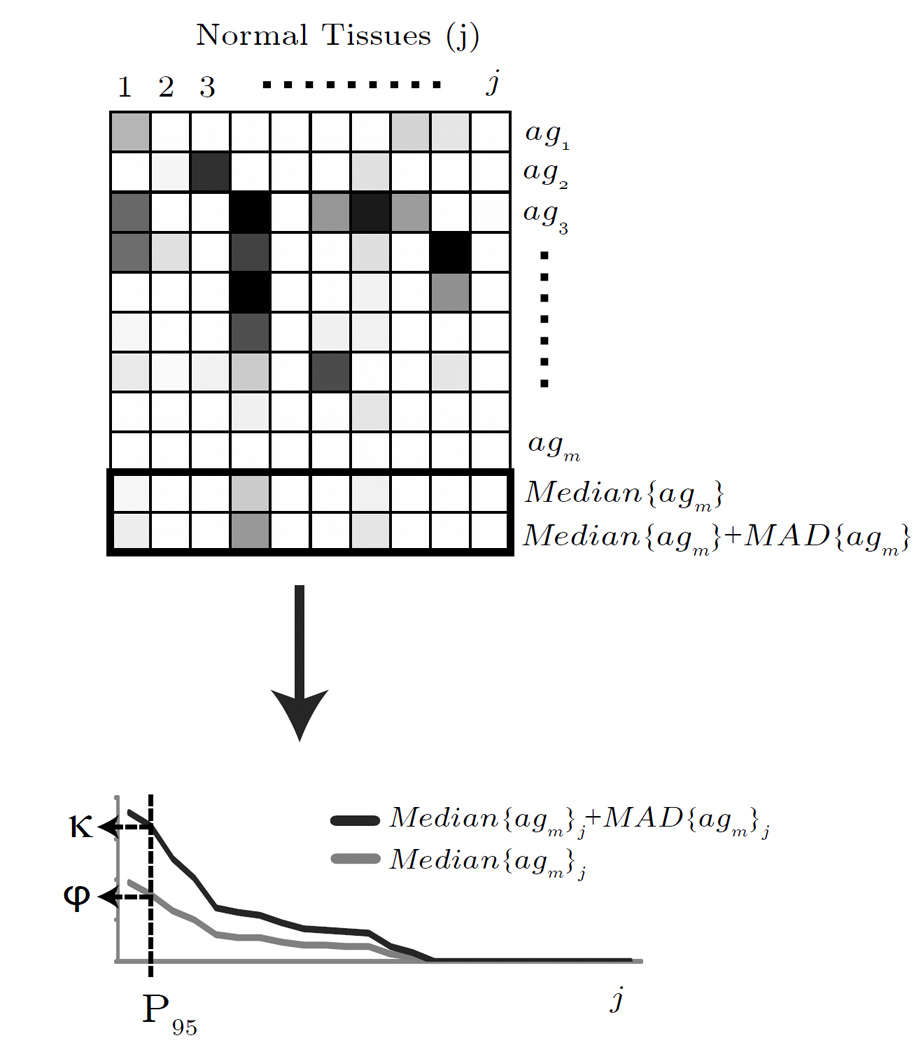
To evaluate the
expression silence profile of candidate antigens in normal tissues, we
first need to specify the expression silence threshold (φ)
indicating the maximum noise signals from
nonexpressing genes, and the
immunogenicity constant (κ)
representing the estimated
threshold of
expression signals below which the gene
products would presumably not be able to educate the developing immune
system for central tolerance specific to these antigens (Figure
3).
This was done through analyzing 91 reported TSAs compiled from
publications1-3.
The expression silence threshold (φ)
was set according to the 95th
percentile of the median expression levels of these TSAs across 34
normal tissues except the immunoprivileged organ testis, placenta, and
ovary. The 95th percentile was chosen to avoid
misrepresentation by the technical outliers of microarray hybridization.
![]()
where
The
immunogenicity constant (k)
represents the maximum expression level that is normally “overlooked” by
the immune systems. Practically, it was estimated with the upper 95th
percentile of the median deviated expression level of known tumor
antigens (Figure 3).
The immunoprivileged organs were excluded from the analysis because
antigens expressed there are usually not accessible to developing
lymphocytes so that their immunogenicity should be well preserved. The
95th percentile, as opposed to the greatest values, also
avoids the possible misrepresentation by technical outliers.
![]() (m
and j: antigen
m in tissue
j)
(m
and j: antigen
m in tissue
j)
where
|
Figure 3. The algorithm for
determining the expression silence signal
φ
and the immunogenicity constant
κ.
The microarray gene
expression data from normal tissues 1,…,j for antigens 1,…,m are
shown in the upper heat map. The median expression signal
Median |
B. Depreciatory Penalty
The Depreciatory
Penalty (DP) score is calculated on the basis of expression signals
across healthy somatic tissues. As the expression signals less than φ
are considered as noise signals, and should not affect the DP score, the
gene expression signals were transformed by subtractingφfrom
each expression value and setting the negative values to zero. The
transformed values were further divided by (κ-φ)
to underscore the magnification of these values against the expression
value presumably not recognizable by immune systems (Figure
2b).
Let
![]()
where
xi is the
expression signal of ith
sample in tissue type j,
yj are tissue
j specific ratio.
The depreciatory penalty was then
estimated from the
weighted power sum of
tissue-specific ratios
yj
across all normal tissues:
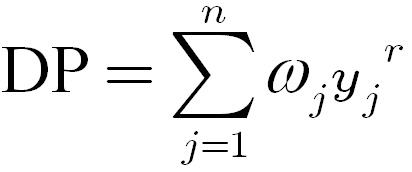 (1)
(1)
Where
ωj
is
weight of tissue type j,
n is the total number of
normal tissue types.
The
power r penalizes the
expression signals in somatic tissues. By testing
the enrichment of the 8 prototype tumor antigens in top-scoring genes (Figure
4)
with
Kolmogorov-Smirnov statistics, the
optimal range of power
r
was found to be
between
1 and 1.5 (1
≤
r
≤
1.5).
The exact value should be set according to research purposes. A higher
value directs findings towards antigens with more restrictive expression
in somatic tissues, whereas a lower one tends to predict over-expressed
antigens. In this study, we used
r
=1.2 for the calculation of the HEPA score to reveal the genes with
substantial expression in tumor tissues while retaining a strict
expression-silence in normal tissues.
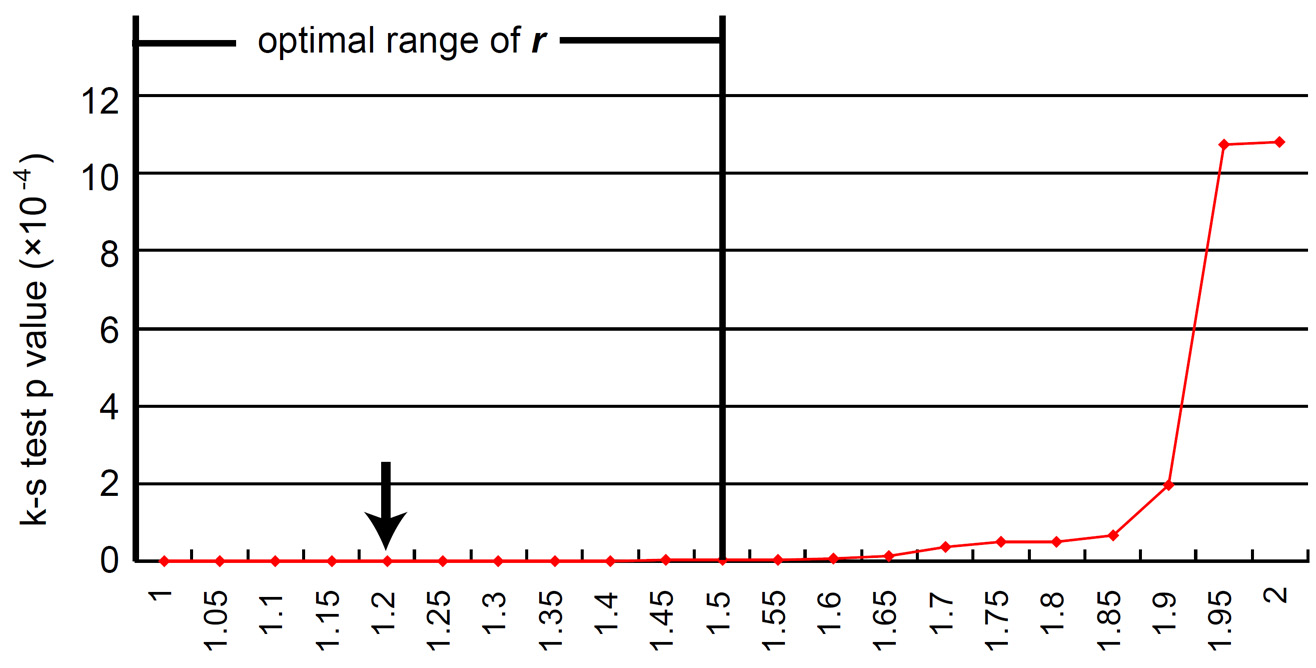 Figure 4. Determination of the optimal range of power r in the calculation of Depreciatory Penalty. The Kolmogorov-Smirnov (K-S) test was performed to benchmark the performance of max HEPA score in prioritizing the eight established TSAs from the genome, with different power r ranging from linear to square. A range of power r from 1 to 1.5 generates most favorable prioritization results. |
To determine the tissue weights (ωj),
the tissues were first empirically ranked according to their
consequences in autoimmune toxicity and surgical resectability (Table
1),
and the
weights were then calculated using Analytic Hierarchy Process (AHP,
Thomas L. Saaty, 1970).
Let
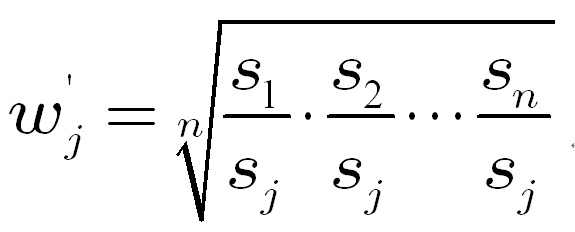
The
weight for tissue j can be
calculated as follows,
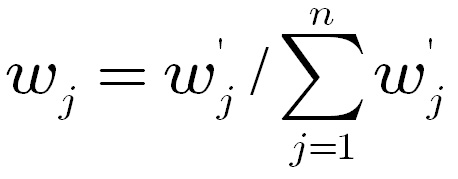
The
weights calculated from AHP tend to exaggerate the difference of top
ranked tissues, thus adjustments were made to balance the weights of the
top three tissues, the heart, kidney and lung, as autoimmune response
against any of these organs will be life-threatening. In situations
where the tissue is dispensable or even resectable in the course of
cancer therapy, the weight was set to zero.
To nominate differentiation antigens
from specific cancers, including melanoma, prostate and gastrocolonic
cancer, the weights of the normal tissues from which the tumor arises
were also set to zero.
Table 1. The weights for normal adult somatic tissues for the calculation of Depreciatory Penalty score.
| Rank | Normal Tissues | Weight | Rank | Normal Tissues | Weight | Rank | Normal Tissues | Weight | ||
| 1 | heart | 0.169 | 13 | spinal cord | 0.02 | 25 | uterus | 0.004 | ||
| 2 | kidney | 0.159 | 14 | pancreas | 0.019 | 26 | adipose | 0 | ||
| 3 | lung | 0.149 | 15 | nerve | 0.017 | 27 | breast | 0 | ||
| 4 | brain | 0.065 | 16 | vessels | 0.016 | 28 | fetal | 0 | ||
| 5 | cerebellum | 0.052 | 17 | airtube | 0.015 | 29 | ovary | 0 | ||
| 6 | liver | 0.043 | 18 | small intestine | 0.014 | 30 | placenta | 0 | ||
| 7 | muscle | 0.037 | 19 | skin | 0.011 | 31 | soft tissue | 0 | ||
| 8 | bone marrow | 0.032 | 20 | thyroid | 0.011 | 32 | testis | 0 | ||
| 9 | thymus | 0.029 | 21 | stomach | 0.007 | 33 | urethra | 0 | ||
| 10 | lymphnode | 0.026 | 22 | colon | 0.007 | 34 | vagina | 0 | ||
| 11 | spleen | 0.024 | 23 | esophagus | 0.006 | |||||
| 12 | adrenal | 0.022 | 24 | prostate | 0.005 |
C. Beneficial Bonus, BB
The beneficial bonus is a signal measure
of increased beneficial outliers in specific cancer
k. The scoring function for
the beneficial bonus takes the log 2 ratio of the adjusted upper
quartile mean ![]() .
.
![]() was
calculated by averaging the expression signals from P75 to P95,
representing the mean biological outlier expression signal. The log 2
transformed
was
calculated by averaging the expression signals from P75 to P95,
representing the mean biological outlier expression signal. The log 2
transformed ![]() features
the marked over-expression of candidate genes in a subset of tumors
while preserving a similar scale with DP (Figure
2b). Let
features
the marked over-expression of candidate genes in a subset of tumors
while preserving a similar scale with DP (Figure
2b). Let
![]()
Then the Beneficial Bonus of cancer type
k is given as
![]() (2)
(2)
D. HEPA score
The depreciatory penalty score was then
subtracted from the beneficial bonus score, which was designated as the
HEPA score.
![]() (3)
(3)
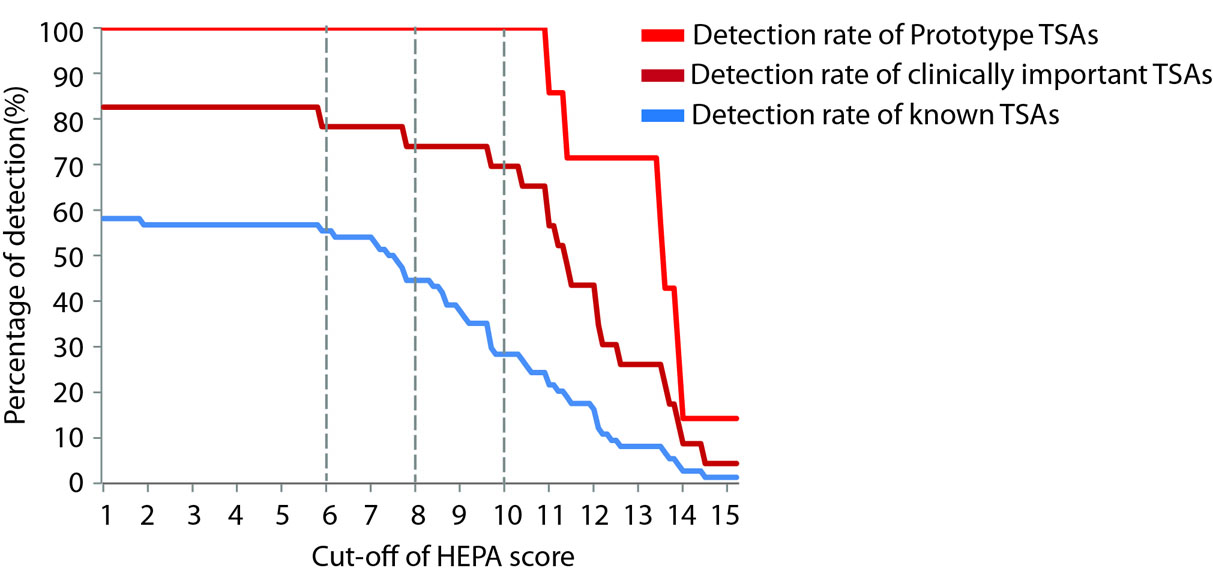 Figure 5. Determining the cut-off for a meaningful HEPA score based on optimal detection of known TSAs. The detection rate of known TSAs is determined with different cut-offs of HEPA score ranging from 1 to 15. A cut-off of 6 is found to be the highest cut-off offering optimal detection of known TSAs and clinically important TSAs. The detection rates will significantly drop with a cut-off higher than 6. In addition, a HEPA score >8 is empirically considered as high and >10 as very high. All prototype tumor antigens have a HEPA score >10. Known TSAs and clinically important TSAs used in this analysis are listed in Supplementary Table 3. |